Image segmentation using OpenCV
Before getting into image segmentation let's try to understand what is the meaning of segmentation and what is the goal of segmentation in general. The goal of segmentation is to separate different parts of an image into sensible coherent parts.Image segmentation is a very important process in computer vision where we are basically taking an visual input and divide into segments for analysing that particular image.In segmentation we try to understand different parts of an image and try to understand what object they belong to. Main purpose of segmentation is to simplify or change representation of the image and make it easy to analyze.
Image segmentation is the most basic principle behind Object detection and object classification.
In this article I would like to explain one of the most basic and easiest technique used for image segmentation process i.e image segmentation using contours
USING CONTOURS TO DRAW BOUNDARIES AROUND THE OBJECT OF AN IMAGE
Contours are continuous lines that bound the boundary of an object in an image.We have heard the word contour being used in geography regularly, it basically refers to an imaginary line connecting points having the same elevation from a certain given level. In image processing the contours are used for bounding an user specific object.But edges and contours are not the same. Edges refer to an extrema of an image gradient in the direction of gradient and contours are basically referred to as closed curves which are considered as boundaries (few image processing algorithms call them like that).
Now let’s extend geographical understanding of contours to image processing. In image processing, applying contours to an image refers to selecting a line of pixels that has the same value and this line encloses a group of pixels much similar to a line of pixels.
This method can be implemented as a code using python programming language and using libraries such as opencv, numpy and matplotlib. Before getting into code let me give you a brief introduction about each libraries:
Opencv:
OpenCV (Open Source Computer Vision Library) is an open source computer vision and machine learning software library. OpenCV was built to provide a common infrastructure for computer vision applications and to accelerate the use of machine perception in commercial products.
Numpy:
NumPy is an open source project aiming to enable numerical computing with Python.NumPy is developed in the open on GitHub, through the consensus of the NumPy and wider scientific Python community.
Matplotlib:
Matplotlib is a plotting library for the Python programming language and its numerical mathematics extension NumPy
Drawing contour around an object can be broken down into following steps:
1)Importing opencv,numpy, matplotlib libraries:
If you haven't installed these libraries then execute following statements before importing them:
pip install numpy
pip install opencv-python
pip install matplotlib
import numpy as np
import matplotlib.pyplot as plt
import cv2
2)Reading image as input:
image = cv2.imread('square.png')
3)Converting image from BGR color channel to RGB color channel and displaying the image:
image = cv2.cvtColor(image, cv2.COLOR_BGR2RGB)
plt.imshow(image)
output:

4)Converting image to grayscale i.e one channel color mode:
gray = cv2.cvtColor(image,cv2.COLOR_RGB2GRAY)
5)Applying thresholding(Binary Threshold) on the gray scale image:
retval,binary = cv2.threshold(gray, 210,225, cv2.THRESH_BINARY_INV)
6)Displaying the thresholded image
plt.imshow(binary, cmap='gray')
Output:

7)Now on passing the image to findcontours() function in opencv which returns the contour list
cnts = cv2.findContours(binary, cv2.RETR_EXTERNAL, cv2.CHAIN_APPROX_SIMPLE)
8)Make a copy of the image for future reference(not mandatory):
contours_image = np.copy(image)
contours = cnts[0] if len(cnts) == 2 else cnts[1]
9)Applying contour to the copy of original image:
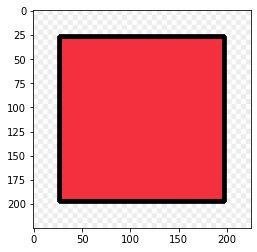
contours_image = cv2.drawContours(contours_image, contours, -1, (0,0,0),3)
10)Displaying the image after applying contours:
plt.imshow(contours_image)
Output:

Link to the code is given below: https://github.com/sachinbhat2001/Computer_Vision/blob/master/Contours.ipynb
References:
https://en.wikipedia.org/wiki/Matplotlib
https://www.pinclipart.com/pindetail/oihxwJ_red-square-clipart-eye-paper-product-png-download/
https://medium.com/contours-in-opencv-for-beginners/contours-in-opencv-for-beginners-b4d6ae56a745
